A Measure of Greatness
Dave Wilson |
I’m not entirely sure when the ICC player ratings began – the Test team ratings were developed by David Kendix and first published in 2003 – though to a certain extent when they first appeared is irrelevant as the ratings have been retrospectively calculated since the first Test. In any case there is a blog which began in 2008, the same year that archived press releases are available from, so it may have been that year. Rightly or wrongly, the ratings have come to be the de facto measure of player greatness and are oft-quoted when the issue arises of just how good a player is.
The details of the actual method and the database used to produce the ratings are not available to the public, however the website has an FAQ page and from that, along with the “About the ICC Ratings’ page we can glean some background information. First, the ratings are produced only using the information available on the match scorecard, so for example no subjective assessment is made as regards conditions. The factors used to generate a batsman’s rating are:- runs scored, strength of opposition bowling, the level of match scoring, the match result and whether or not the batsman was not out, all of the above combining to provide a ratings points value with a maximum of 1000. A batsman loses 1% of his rating points for every match he misses and will be dropped from the list if he appears in no Tests within the qualfication period (12-15 months). New batsmen initially get 70% of their ratings points after 10 Tests, increasing to 100% after 40 Tests; I presume the latter qualification aplies to players now rather than those of yesteryear, as 40 Tests would represent a signficant amount of playing time in the 19th century. The ratings take into account the player’s entire career with more emphasis on most recent performances, however as the points value increases and decreases depending on recent form there is a discernible peak for each batsman.
Obviously the peak rating is one method of comparing the best batsmen of all-time; there have been 27 players all-time who have peaked at or above 900 and that is as good a place as any to begin assessing the validity of the ratings:-
MAX PLAYER
961 Don Bradman (Aus)
945 Len Hutton (Eng)
942 Jack Hobbs (Eng)
942 Ricky Ponting (Aus)
941 Peter May (Eng)
938 Garry Sobers (WI)
938 Viv Richards (WI)
938 Clyde Walcott (WI)
938 Kumar Sangakkara (SL)
935 Matthew Hayden (Aus)
935 Jacques Kallis (SA)
933 Mohammad Yousuf (Pak)
927 Everton Weekes (WI)
927 Graeme Pollock (SA)
922 Doug Walters (Aus)
922 Dudley Nourse (SA)
921 Neil Harvey (Aus)
921 Michael Hussey (Aus)
917 Denis Compton (Eng)
916 Sunil Gavaskar (Ind)
915 George Headley (WI)
914 Ken Barrington (Eng)
911 Brian Lara (WI)
909 Kevin Pietersen (Eng)
903 Hashim Amla (SA)
901 Shriv Chanderpaul (WI)
900 Michael Clarke (Aus)
Some great names there to be sure, and it doesn’t take a truly great system to rate Bradman number one all-time, but even though the above represents a peak value rather that maintained over a full career, you’d have a tough time convincing many of our forum members that Jacques Kallis deserves to be ranked so far above Neil Harvey or Brian Lara. And I would hazard a guess that many of you have spotted that one name is conspicuous by its absence, that of Sachin Tendulkar. Tendulkar has never achieved 900 points using this measure, reaching a peak of 898 in 2002, though I was also surprised that Walter Hammond did not reach that landmark, his highest being 897 shortly after the Bodyline series. But, as the ratings producers themselves state, the peak is not necessarily representative of the player’s overall career greatness.
The site ran a blog from 2008-2011 and came up with several other methods of ranking the all-time greats. For example, there is the most time spent at number one, which is a good measure of sustained greatness and also dominance over contemporaries, here measured by the number of total Tests involving all teams over the time the player was in top spot:-
GMS PLAYER
189 Garry Sobers (WI)
179 Viv Richards (WI)
140 Brian Lara (WI)
125 Sachin Tendulkar (Ind)
94 Steve Waugh (Aus)
93 Don Bradman (Aus)
83 Ricky Ponting (Aus)
81 Graham Gooch (Eng)
61 Jack Hobbs (Eng)
60 Len Hutton (Eng)
Interesting that the top three are West Indian. Obviously this method would penalise those who played in an era where fewer Test matches were played, but we can also look at the time spent at number one as a proportion of the player’s career:-
PCG PLAYER
54% Don Bradman (Aus)
33% Peter May (Eng)
32% Gary Sobers (WI)
32% Len Hutton (Eng)
23% Jack Hobbs (Eng)
Incredible that Bradman was top-ranked for more than half of his career. Peter May is helped here in that his career was relatively short, at ten years being signficantly shorter than the others on this list. Rating players in terms of how long they spent at number one of course only highlights the 65 players who made it to the top, and we really need some measure which rates all players.
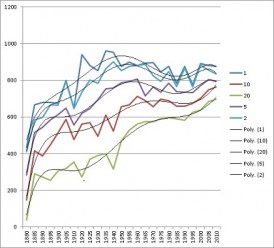
The graph shown above illustrates the increasing levels of overall quality over time, what evolutionary biologist Stephen Jay Gould noted as the “shrinking variation” between the best and worst players (Gould was discussing baseball, but the same process applies in cricket). It’s a little less obvious looking at the number one spot, mainly thanks to Hobbs and Bradman, however if we observe the trend for numbers 5, 10 and 20 we can observe a) the gradual increase over time and b) the gradually reducing differential between each position. We can also see a dip from the 60s to the turn of the milennium; it seems that most of us have lived through somewhat of a batting slump until quite recently. It would be interesting to see how the ratings looked with matches against Bangladesh excluded, though to be fair the upturn occurred before Bangladesh entered the fold. We can also see that the 20th-best batsman now rates as highly as the 5th-best in Hobbs’ time. Note that this graph doesn’t cover all dates, rather it covers 5-year periods to illustrate the trends; so for exmaple there probably isn’t a downturn in position 2 in the 2010s, though the graph trend suggests this.
Despite the evidence of the graph, the ICC blog has tended to use the same measure of greatness regardless of era, which is 900 as a measure of peak greatness and 800 as a measure of sustained greatness. The first batsman to achieve a rating of 800 was Clem Hill, followed shortly afterwards by his team mate Victor Trumper. The first to achieve a rating of 900 points was Jack Hobbs in 1912, a mark not matched until Bradman in 1933. In terms of sustained greatness, maintaining a mark of 800 is a good measure. Here is that list in terms of days spent at that level:-
DAYS PLAYER
6480 Don Bradman (Aus)
6419 Jack Hobbs (Eng)
6106 George Headley (WI)
5070 Garry Sobers (WI)
4241 Walter Hammond (Eng)
3023 Viv Richards (WI)
2791 Brian Lara (WI)
2516 Neil Harvey (Aus)
2271 Sachin Tendulkar (Ind)
2230 Ricky Ponting (Aus)
In terms of an all-time list of the best ever batsman, this list as compared to the others above would come closest to what I would personally consider to have been the greatest.
Another way in which the player ratings could be used is to rate batting line-ups, i.e. measure the greatness of the best batting talent ever assembled in one side. In doing so, I’ve considered only the top seven batsmen so as to exclude players who are selected for other skills. The line-up assembled to represent the International XI against Australia in 2005 featured Graeme Smith, Sehwag, Dravid, Lara, Kallis, Inzamam and Flintoff was generally considered to have been one of the best ever, if not the best. That squad does indeed represent the best ever in terms of actual ratings, with an average actual points of 793, though some said that the Aussie line-up which opposed them was just as good. The actual points rating of the Australia batting line-up, comprising Langer, Hayden, Ponting, Clarke, Katich, Gilchrist and Watson was 633, some way short of the International XI. However, if we look at the all-time peaks for each player, both line-ups rate exactly the same, 852.
That brings up an interesting question, i.e. how should we rate batting line-ups, on their actual ratings at the time or on their all-time ratings? Obviously the players will reach their peaks at different times, but it’s difficult for us to disassociate the all-time value of a player when looking at a line-up from a particular time. In 2010, the blog looked at the best teams of the decade of the 2000s and, other than the International XI discused above, the top 50 or so line-ups were all Australian, the best of which assembled for the Johannesburg Test of February 2002 – that team, which featured Langer, Hayden, Ponting, the Waugh twins, Martyn and Gilchrist, measured just short of the International XI in terms of actual ratings at 776.
However, when measured based on their all-time peak ratings, the finest Australian line-up I could find, and indeed the finest batting line-up of all-time, came together against India in 2003-04 and comprised Hayden, Langer, Steve Waugh, Katich, Ponting, Martyn and Gilchrist, with an average peak score of 869.
Looking at batting line-ups, we can also compare stand-out players in terms of their rating as compared to their contemporaries. Again restricting to the top seven, the highest percentage of total actual ratings points for one player was for Charles Bannerman, where his rating of 447 represented 49% of the total. After that, the highest I could find was George Headley at 41%, followed by John Reid (31%), Brian Lara (31%), Herbie Taylor (31%), Allan Border (30%), Bruce Mitchell (29%) and Inzamam (29%). As mentioned earlier, I don’t have access to the database so I’ve had to manually look at those which came to mind.
To conclude, I’d like to re-visit the peak ratings. As mentioned earlier with regard to the graph, the 20th best player nowadays compares to the 5th best player in Hobbs’ day, yet Hobbs peak rating is better than everyone who has played since he hung up his pads with just two exceptions – Bradman and Hutton. If we look at the degree of dominance which that represents as compared to others, which I would assume is somewhat era-dependent, the differential between first and second at the time of each batsman’s peak also tells a story:-
PTS PLAYER
+206 Jack Hobbs (Eng)
+102 Viv Richards (WI)
+85 Garry Sobers (WI)
+76 Sunil Gavaskar (Ind)
+73 Matthew Hayden (Aus)
+68 Len Hutton (Eng)
+58 Ken Barrington (Eng)
+46 Don Bradman (Aus)
These numbers aren’t the be-all and end-all, however this figure, when taken together with his very high peak rating, would seem to support a claim that Jack Hobbs, rather than Bradman, is the greatest of all-time.
If you believe this sort of thing, of course.


Leave a comment