Career Impact Profiles
Dave Wilson |In this, the latest in a series considering Career Impact, I’ve diverged slightly from the aggregates/averages of career impact discussed in the previous features. The reason for this is that it occurred to me that, as with all aggregates and averages, it only tells part of the story – the end, if you like, but not the means.
As an example, look at Johnny Briggs and Bobby Peel, England left-arm spinners who plied their trade before the Great War, from 1884-96. Despite the similarity in their delivery, England managed to find room in the side for both of them in 17 Tests, though over their Test careers Peel out-bowled Briggs to the tune of 5 wickets per match (101 in 20 Tests) as opposed to 3.6 wickets per match for Briggs (118 in 33 Tests). Both were useful batsmen, Briggs slightly shading Peel in average, with both having three scores over 50, Briggs even managing a century. Despite Peel having a higher return of wickets/Test, Briggs managed four 10-wicket matches to one for Peel, also achieving more 5-wicket innings, nine against five for Peel.
It would appear from a look at the traditional stats that Peel must have had more impact per match than Briggs with his higher wickets per match, and indeed if we look at their career impact from an aggregates and averages point of view that also appears to be the case – Peel totalled 227 in career impact percent with an average per match of 11.36, while Briggs totalled 281 at an average per match of just 8.53. However, if we look at their career impact profiles, with a rolling average over the previous five Tests, a slightly different picture emerges (note that I first tried averaging over 10 Tests, but this flattens out most of the peaks to such a degree as to be much less illuminating; similarly, a plain match-by-match profile has so many peaks and troughs as to again be uninformative):-
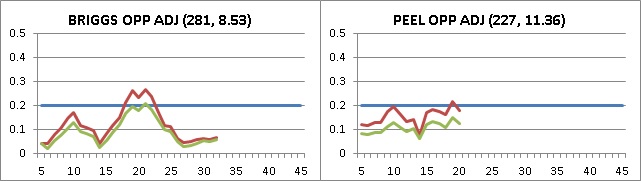
A few words on these charts, which are dotted throughout this piece. The blue line at 0.2 represents what experience of looking at hundreds of these profiles has taught me, which is that an average of 0.2 (or 20%) per match is a reasonable impact threshold of a true Test-calibre player – almost all of the players we’ll look at flirt with the 20% line at one or more points in their career. Some exceed this by a significant margin, while a few actually never reach it. Nonetheless, 20% represents a reasonable threshold of Test-calibre for impact on match results.
SOME ADJUSTMENTS
Opportunity
As I’ve mentioned previously, pre-WW1 bowlers had a certain advantage over those who came later, in that the way bowlers were used in those days meant that fewer bowlers shared the wickets; if we didn’t adjust for that, basically most of the top-rated impact players would be pre-WW1 bowlers. As a result, the profiles of these players show their actual impact in brown, with their adjusted impact in green. The totals and averages I quoted earlier for Briggs and Peel are based on the adjusted figures. The adjustments vary in magnitude between 1877 and 1914, such that after World War I no adjustment is necessary. Note that bowlers that had a higher percentage of their impact contributed by their bowling, with little impact from batting and fielding, may appear to have had their impact marked down more than bowlers with more all-round skills.
Strength of Opposition
I’ve also adjusted these figures based on the strength of the opposition. Originally, I had adjusted the impact based on the ICC team ratings definition of a one-sided contest, which is one where the difference in team rating exceeds 40. However, this would mean for example that the impact in 2003 of a match performance between Zimbabwe and Bangladesh would be the same as an Ashes contest in the same year. So I decided to use the actual current rating of the opposition as I calculated for this piece and for Series Points, using the rating to provide an offset, based on a norm of 100 for team rating.
Length of Career
Finally, in order to more readily differentiate those whose career was shortened for whatever reason, as well as those who burned brightly but fleetingly, from those who were consistent over a longer period, I’ve normalised all of the pre-WW1 profiles to a baseline of 45 Tests; though some played in more than that number of Tests, if I normalised to the highest number many more profiles would look unnecessarily cramped.
A TALE OF TWO SPINNERS
So back to Briggs and Peel. We can see now what the aggregate and average figures were hiding. Hardly bowling at all in his first five Tests, Briggs achieved a peak impact value of 25.92% (19.53% adjusted) between his 16th and 20th Test, during which period he took 42 wickets, a higher level of peak impact than Peel ever attained. That wasn’t even Brigg’s highest peak – that came two games later, at which time he’d enjoyed impact contributions over 30% in four of five matches. Peel’s highest impact figure was 21.46% (15.06%), however he never dipped below 10% (6%), an average mark which Briggs failed to exceed after 13 of his 33 Tests.
Peel’s most impactful performance is, perhaps unsurprisingly, his performance on a sticky wicket in the famous 10-run victory over Australia at Sydney, when England followed on and Australia, after amassing 586 in their first innings, had failed to turn 113 for two into the 177 required to win. That performance far exceeded anything achieved by Briggs in terms of match impact, but the reason Peel didn’t maintain as high a peak as Briggs is that Peel’s best impact performances were spread apart, though whether or not this was due to his well-known off the field issues is debatable – his performance described above came while apparently still drunk when the final day’s play began.
AVERAGE vs PEAK
Another aspect of impact profiles becomes apparent by looking at all-rounders and contemporaries Len Braund and Warwick Armstrong, both of whose performances came before the Great War (largely, in Armstrong’s case, with no pun intended). Certainly looking at traditional statistics Armstrong looks by far the most impactful player – Braund’s averages in 23 Tests are 25.97 with the bat and 38.51 with the ball (2 wickets/match), to go with 39 catches, while Armstrong’s figures are respectively 38.68, 33.59 (around 1.6 wickets/match) and 44 catches in 50 tests.
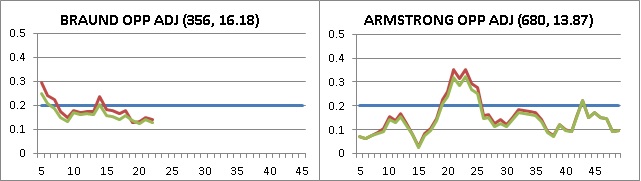
In terms of career impact, Braund totaled 356 at an average of 16.18, whereas Armstrong managed almost twice as high a career impact with 680, but at a lower average of 13.87. This disparity would seem to be counter-intuitive, however when we look at their profiles all is revealed; Braund has a higher average because he never dipped below 12% rolling average, though his short-lived peak at the very start of his career is overshadowed by Armstrong’s higher peak which, maintained as it was for a longer period, supports Armstrong’s higher rating.
PRE-WAR REVIEW
Career impact profles, then, flesh out the simple aggregate and average career impact figures, and also show which players enjoyed a more significant peak. I’d like now to look at a number of pre-WW1 players in more detail. Keep in mind that the impact profiles are based on everything a player does, batting, bowling and fielding, and the scale of that impact varies depending on the state of the match at the time.
APOLOGIES
At this point, I’d like to apologise to those of you who have been kind enough to post positive comments on previous features and were at this point expecting the career impact of the players of the 1990s to be reviewed – I hope you appreciate how much more insight into players’ match impact these profiles afford us.
MORE SPINNERS
Though one of the benefits of the match impact measure is that we can compare players directly inclusive of each discipline, nonetheless we tend to make comparisons based on player’s main discplines, so lets stay with bowlers for the time being and take a look at some of the the other pre-WW1 spinners – here are the career impact profiles of Hugh Trumble, Colin Blythe, Reggie Schwarz, Tip Snooke and Bert Vogler.
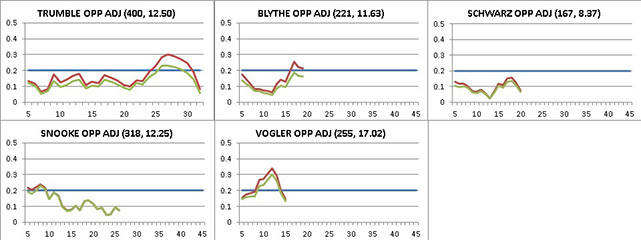
Trumble shows as having the highest aggregate career impact, but South African Bert Vogler has by far the higest average, as well as the highest peak. Though he only played in 15 Tests, Vogler maintained an adjusted rolling average above 20 for five of those 15 Tests (and above 25 unadjusted). Trumble, meanwhie, did not average 20 until his 26th Test, also maintaining that level for five Tests. Trumble’s peak occurred during 1902, in which year he took 53 Test match wickets at a shade under sixteen, throwing in two undefeated fifties and 13 catches for good measure. Vogler’s peak ocurred after a 40-wicket haul over five Tests at the start of 1910, which also saw him snag six catches in a single match.
FAST MEN
Completing the review of pre-WW1 bowlers, here are the quicks, represented by Fred Spofforth, George Lohmann, Charlie Turner, Tom Richardson and Ernie Jones – I’ll deal with the remarkable phenomena that was Sydney Barnes later in this feature.
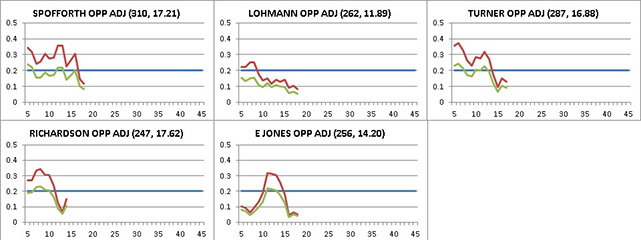
In terms of average impact, Richardson is a litle ahead of Spofforth, then Turner, Jones and finally Lohmann some way back. This might surprise some of you who have heard of Lohmann’s high number of wickets per match and very low average (at 10.75 the lowest ever), however many of Lohmann’s wickets came against a poor South African side and the opposition adjustment takes that into account. A glance at the profiles shows that, despite the disparity in average impact, almost all of them scaled similar heights. And therein lies the enlightening capacity of these profiles – when we think of these bowlers we tend to think in terms of the heights which each of them scaled, rather than how their careers ebbed and flowed. In terms of unadjusted peaks, four of the five exceeded 30%, only Lohmann falling short of that mark (though prior to opposition and era adjustments he did in fact peak over 30%), however their overall profiles are quite dissimilar. Spofforth, despite slightly lagging Richardson in terms of average career impact, would be my pick as the top-rated of the five based on their impact profiles.
BATSMEN
Next up, a group of pre-war batsmen, namely Archie Maclaren, Tom Hayward, Ranji, Gilbert Jessop, Dave Nourse and Warren Bardsley.
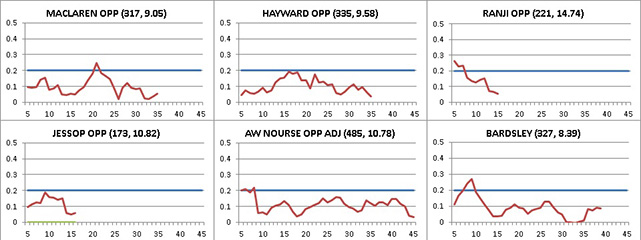
Though I’m aware that Jessop and Nourse also bowled a bit, in Tests there wasn’t that much contribution to their impact score as compared to the impact of their batting. Bardsley was the top run-scorer of this group with 2469 at 40.47, then came Nourse with 2234 at 29.78, Hayward a frustrating 1999 at 34.46, Maclaren 1931 at 33.87, with Ranji just 989 runs but also the highest average of 44.95. In terms of aggregate impact, Nourse was top with 485, while Ranji had the highest per-test average. I included Jessop as I assumed he would show well impact-wise, though to be honest his major impact in Tests was largely limited to the eponymous “Jessop’s match”. Warren Bardsley, despite having the lowest career impact average actually enjoyed the highest peak, around the time of his dual Ashes centuries at the Oval, but tailed off after that and was the only member of this group to hit zero impact average, indeed averaging below zero for two Tests towards the end of his career, so his career impact average is the lowest of the group.
HILL, TRUMPER AND HOBBS
Next we have three giants of pre-WW1 batting in Clem Hill, Victor Trumper and Jack Hobbs; though Hobbs played much of his career after WW1, he played almost the same number of Tests before that so he is included in this review. Hobbs’ average prior to WW1 was actually higher than his career average, 57.32 from 1908-1912 as compared to 56.94 overall. Hill and Trumper respectively averaged 39.21 and 39.04 in Tests, though they played much of their careers prior to the time Hobbs appeared on the Test match scene, both making their debuts in 1896. Nonetheless, as I’ve previously stressed a lower average doesn’t necessarily affect their impact assessment.
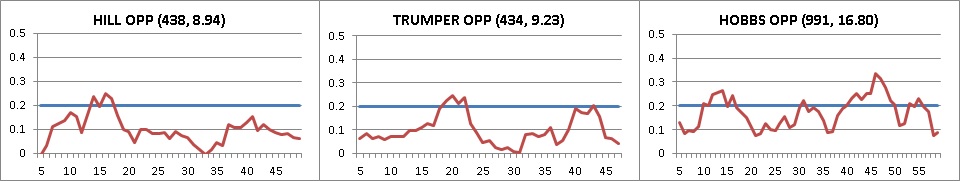
In terms of aggregate impact, Hobbs had far more say in terms of win probability, more than twice as much; of course, he played in more Tests, though not twice as many. This is also reflected in their average career impact figures, with Hobbs again showing as having significantly more impact than his Aussie counterparts. If we look at their profiles, we can see that if we restricted our analysis to the Tests played prior to WW1 (about half-way through Hobbs’ career), there wouldn’t be much between the three of them. Hobbs though enjoyed even more impact after the Great War which distances him somewhat from the other two batting luminaries. Another factor is that Hobbs only barely dipped below 10% on a couple of occasions, whereas both Hill and Trumper approached zero during their careers – Hill’s trough came during a run of five Tests through 1904-05 when he averaged 18.66, Trumper’s during eight Tests surrounding his 112 runs at the MCG in January 1908, when he averaged just 13.46 in those other 15 innings.
ALL-ROUNDERS
All-rounders now, as we take a closer look at FS Jackson, George Hirst, Monty Noble, Wilfred Rhodes, Warwick Armstrong and Charlie Macartney. We looked at Armstrong as compared to Len Braund in the introductory discussion.
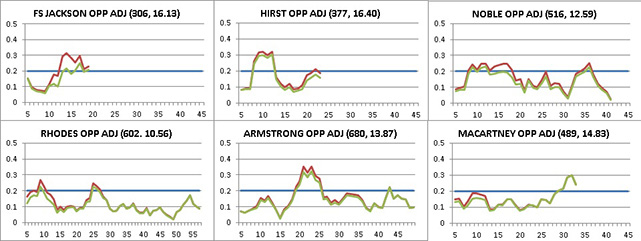
In terms of traditional stats, Rhodes, Armstrong and Macartney fair very well, given their average differentials over longer Test careers. Indeed in terms of career impact aggregate the order is Armstrong, Rhodes, Noble, Macartney, Hirst then Jackson. In terms of career average, however, Hirst shows at number one but with Jackson at number two; both of these had significantly shorter careers than the other four members of this group, however. In terms of peak impact, Armstrong is a clear leader, ahead of Hirst and Jackson. I think I would plump for Armstrong as top-rated pre-WW1 all-rounder. Macartney is unique among this group in enjoying his peak at the close of his career, by which time he was 40.
AUBREY FAULKNER
Finally, I’d like to review two giants of pre-WW1 cricket. First, the great Aubrey Faulkner.
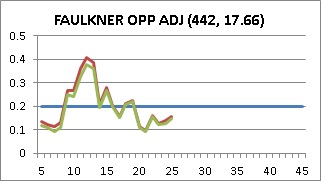
Faulkner averaged 40.79 with the bat while taking 82 wickets at 26.58 in 25 Tests. His career impact average of 17.66 places him ahead of all other pre-WW1 cricketers, save one. Faulkner achieved the highest single game impact performance of the pre-WW1 era – when South Africa beat the England tourists by 19 runs at Johannesburg in January 1910, it was due to Faulkner’s showpiece all-round performance. South Africa opened with 208 runs, Faulkner top-scoring with 78. England then took a 102-run lead on first innings, Faulkner being responsible for five wickets. By the time South Africa wiped out that lead they had already lost four wickets and things looked grim; in came Faulkner, and by the time he was ninth out for 123 South Africa had a lead of 222, which they finally extended to 243, Faulkner again being highest scorer and by a significant margin. Great work by Bert Vogler set up victory, duly sealed by Faulkner with three of the last four wickets. This performance helped him to a peak impact of 40.61 (37.92 adjusted).
The one player who eclipsed Faulkner’s career impact average was the incomparable SF Barnes.
SF BARNES
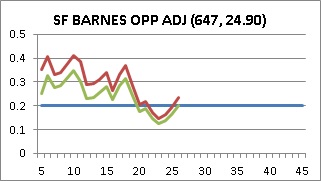
Barnes actualy exceeded an average of 40 on two occasions, and even his adjusted impact average eclipsed 30 on three separate occasions. His career average was a massive 24.90, more than 40% higher than next man Faulkner. Barnes never dropped below even 20% rolling average until his 20th Test, though his late career performances in South Africa are adjusted downwards quite a bit. His highest rated impact performance was not much shy of Faulkner’s in magnitude, that coming is just his second Test when he took 13 Australian wickets at Melbourne.
MEN OF THE MATCH
In a slight digresion, but one which only adds to Barnes’ aura of invincibility, I’d like to look at retrospective Man of the Match awards. Match impact can easily be used to identify a man of the match for all Tests going back to the first in 1877. Looking at the first 134 Tests prior to WW1, the players with the highest number of match awards (unadjusted) are as follows:-
MoM PLAYER
11 SF Barnes
7 Hobbs *
6 Briggs
5 Faulkner
5 Woolley *
5 FS Jackson
4 Trumper
4 Lohmann
4 Spofforth
4 Ulyett
4 Macartney *
The asterisks signify that MoM performances post-WW1 are also included for completeness. Of course, as the above is an unadjusted list we have a lot of bowlers shown here, as their performances in terms of overall cricket history look far more significant than their contemporaries with the bat. The adjusted list looks like this:-
MoM PLAYER
8 SF Barnes
8 Hobbs *
5 Woolley *
5 Faulkner
5 Sinclair
5 FS Jackson
4 Nourse *
5 Hill
While Hobbs’ greatness is not up for question, I have to admit to being somewhat sceptical of Barnes’ greatness prior to this study – his high number of wickets against South Africa, plus a relative dearth of county championship cricket had me downgrading him, at least relative to the other greats of his time. However, it’s clear from all of the above that Barnes was the pre-eminent player of his time; it’s a pity that his differences with the various authorities denied him more Test match opportunities.
NEXT TIME
The next piece will review the players between the wars. Which of course includes Don Bradman.


Leave a comment